Understanding the Water Treatment Process Diagram
We are a leading water treatment products supplier and manufacturer, and we know that visualizing a facility\’s operations is crucial for efficiency, safety, and compliance. A well-structured water treatment process diagram serves as the master blueprint for any purification or wastewater management system. It provides engineers, operators, and stakeholders with a clear, birds-eye view of how a facility functions from start to finish.
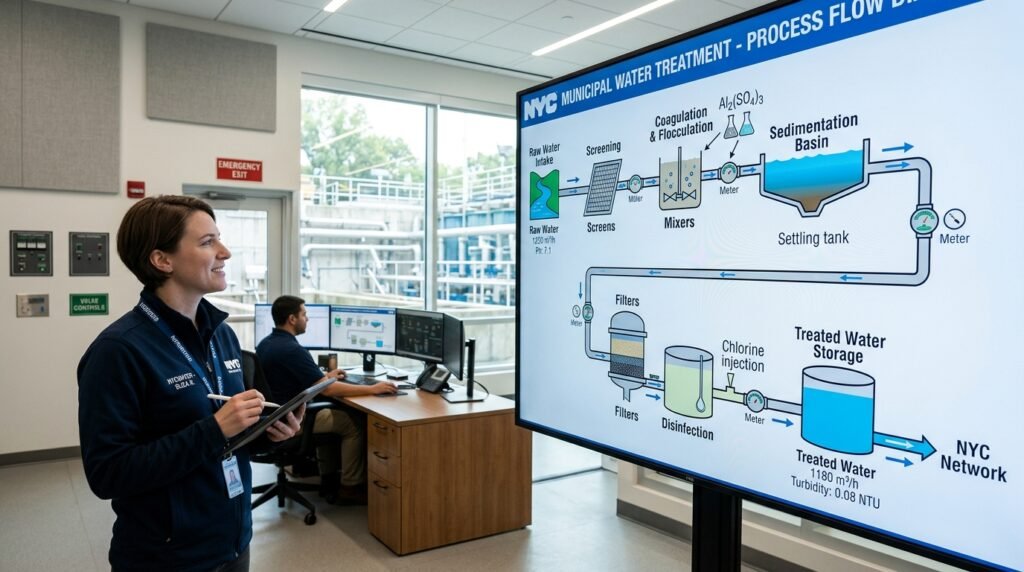
[Image of a standard water treatment process flow diagram]
What is a Process Flow Diagram (PFD)?
A Process Flow Diagram (PFD) is a specialized engineering schematic used to illustrate the general flow of plant processes and equipment. In our industry, the water treatment diagram process visually maps out exactly how raw, untreated water transforms into a clean, safe end product. It strips away minor piping and granular details to focus on the core operational sequence.
Key functions of a PFD include:
- Visualizing the sequence of all major unit operations.
- Identifying major equipment necessary for the purification cycle.
- Displaying critical data such as flow rates, operating temperatures, and material balances.
Key Components of Water Treatment Facilities
Every comprehensive water treatment process diagram highlights specific core units that work in tandem to remove contaminants. While customized designs will vary based on raw water quality and target purity levels, the foundational components remain highly consistent across the global market.
Primary structural and mechanical components:
- Intake Structures: The initial point where raw water is drawn into the facility.
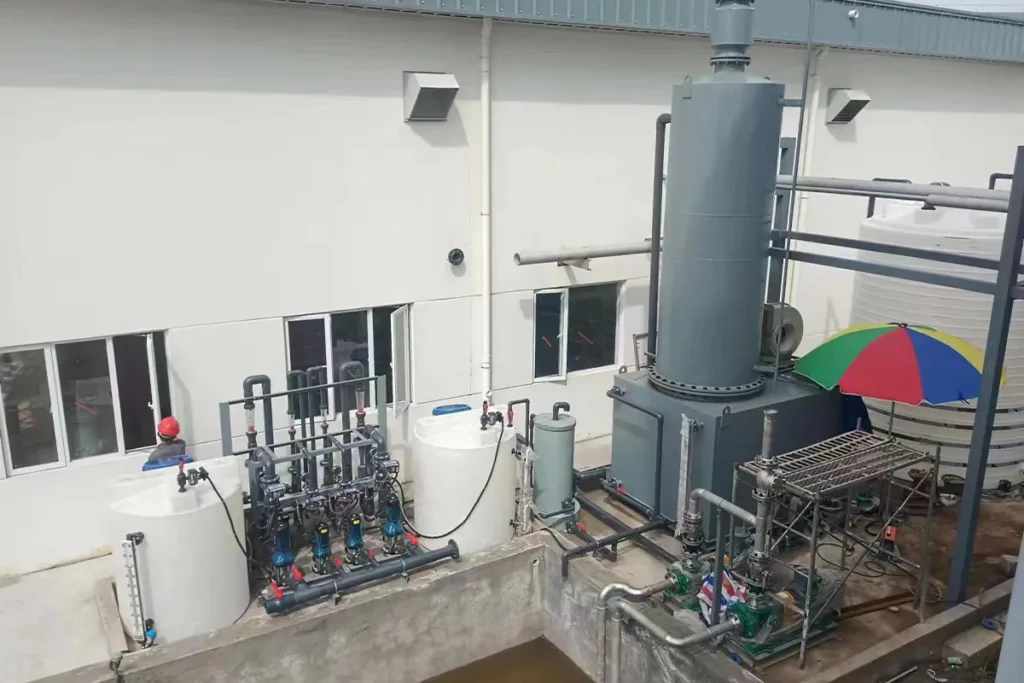
- Chemical Feed Systems: Automated stations responsible for injecting coagulants, flocculants, and disinfectants.
- Clarifiers and Settling Basins: Large-capacity tanks dedicated to the sedimentation process.
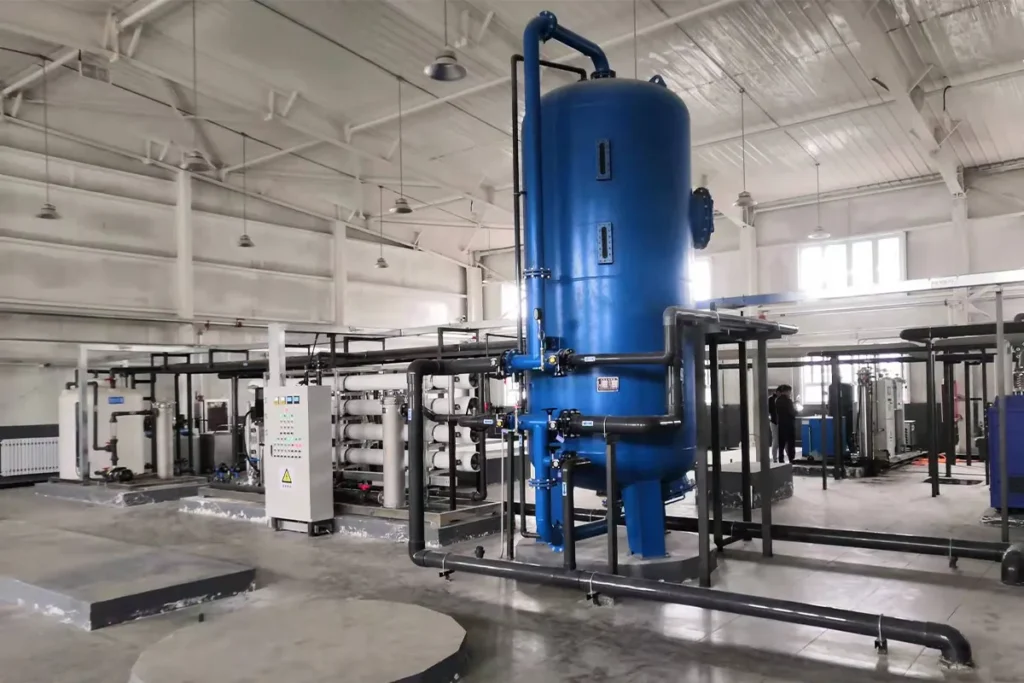
- Filtration Units: Multi-media, carbon, or advanced membrane filters designed to trap microscopic particles.
- Pumps and Control Valves: The essential mechanical drivers that regulate pressure and direct the flow throughout the entire water treatment process diagram.
Drinking Water Treatment Process Diagram
A clear water treatment process diagram is essential for understanding how raw, untreated water is transformed into safe drinking water. We are a water treatment products supplier and manufacturer, and we rely on these precise visual workflows to build efficient, global-standard systems. Every phase of the water treatment diagram process plays a critical role in public health.
Coagulation and Flocculation Stages
The purification journey starts by addressing suspended dirt and particles.
- Coagulation: We introduce safe chemicals with a positive charge into the raw water. This neutralizes the negative charges on dirt and dissolved particles.
- Flocculation: The water is gently mixed. This causes the neutralized particles to collide and bind together, forming larger, heavier clumps known as \”floc.\”
Sedimentation and Clarification
Once the floc is formed, the water needs a quiet environment to separate.
- Settling: The water flows into a large settling basin or a highly durable water treatment tank.
- Separation: Gravity pulls the heavy floc particles to the bottom, creating a layer of sludge. The clarified water remains at the top, ready for the next step.
Filtration Process Breakdown
Even after sedimentation, the clear water still holds microscopic impurities that must be removed.
- Multi-Layer Filtration: The water passes through filters made of varying materials, such as sand, gravel, and activated carbon.
- Microscopic Purification: These distinct layers trap dissolved particles, dust, parasites, and remaining bacteria that did not settle out during clarification.
Disinfection and Distribution
The final step ensures the water remains safe as it travels to communities.
Pathogen Elimination: Disinfectants like chlorine or chloramine are added
- Coagulation: We introduce safe chemicals with a positive charge into the raw water. This neutralizes the negative charges on dirt and dissolved particles.
- Flocculation: The water is gently mixed. This causes the neutralized particles to collide and bind together, forming larger, heavier clumps known as \”floc.\”
Sedimentation and Clarification
Once the floc is formed, the water needs a quiet environment to separate.
- Settling: The water flows into a large settling basin or a highly durable water treatment tank.
- Separation: Gravity pulls the heavy floc particles to the bottom, creating a layer of sludge. The clarified water remains at the top, ready for the next step.
Filtration Process Breakdown
Even after sedimentation, the clear water still holds microscopic impurities that must be removed.
- Multi-Layer Filtration: The water passes through filters made of varying materials, such as sand, gravel, and activated carbon.
- Microscopic Purification: These distinct layers trap dissolved particles, dust, parasites, and remaining bacteria that did not settle out during clarification.
Disinfection and Distribution
The final step ensures the water remains safe as it travels to communities.
Pathogen Elimination: Disinfectants like chlorine or chloramine are added to kill any lingering viruses and bacteria.
Advanced Protection: Many modern facilities integrate a commercial UV water treatment system.
Coagulation: We introduce safe chemicals with a positive charge into the raw water. This neutralizes the negative charges on dirt and dissolved particles.
Flocculation: The water is gently mixed. This causes the neutralized particles to collide and bind together, forming larger, heavier clumps known as \”floc.\”
Sedimentation and Clarification
Once the floc is formed, the water needs a quiet environment to separate.
- Settling: The water flows into a large settling basin or a highly durable water treatment tank.
- Separation: Gravity pulls the heavy floc particles to the bottom, creating a layer of sludge. The clarified water remains at the top, ready for the next step.
Filtration Process Breakdown
Even after sedimentation, the clear water still holds microscopic impurities that must be removed.
- Multi-Layer Filtration: The water passes through filters made of varying materials, such as sand, gravel, and activated carbon.
- Microscopic Purification: These distinct layers trap dissolved particles, dust, parasites, and remaining bacteria that did not settle out during clarification.
Disinfection and Distribution
The final step ensures the water remains safe as it travels to communities.
- Pathogen Elimination: Disinfectants like chlorine or chloramine are added to kill any lingering viruses and bacteria.
- Advanced Protection: Many modern facilities integrate a commercial UV water treatment system to instantly neutralize pathogens using ultraviolet light without altering the water\’s taste.
- Delivery: The fully treated, safe drinking water is stored in closed reservoirs before being pumped through the distribution network to homes and businesses.
Wastewater Treatment Process Flow
Understanding a standard water treatment process diagram is the best way to see exactly how we turn raw sewage into clean, safe effluent. Here is a straightforward breakdown of the core steps involved in treating wastewater.
Preliminary and Primary Treatment
The journey begins by removing the large, obvious debris. Bar screens catch items like plastics and rags, while grit chambers let heavy materials like sand settle out. During primary treatment, the wastewater flows into large settling basins. To significantly speed up this settling phase and optimize the physical space of the plant, many modern facilities rely on wct honeycomb inclined tube packing for sedimentation tanks. This simple but effective design allows heavier solids to drop to the bottom much faster.
Secondary Treatment and Aeration Tanks
Next up is the biological engine of the facility. We pump massive amounts of air into deep aeration tanks to support beneficial bacteria.
* **The Process:** Microorganisms naturally consume and break down the dissolved organic waste.
* **The Result:** A drastic reduction in biological pollution.
Any clear water treatment diagram process will highlight this aeration phase as the heart of the plant, where nature is put to work doing the heavy lifting.
Biological Nutrient Removal (BNR)
Standard secondary treatment isn\’t always enough to protect our local lakes and rivers. We must also strip out excess nitrogen and phosphorus to prevent harmful algae blooms. Because we are a water treatment products supplier and manufacturer serving a global market, we know that setting up specialized BNR zones—manipulating oxygen levels to target specific bacteria—is crucial for meeting today’s strict environmental discharge regulations.
Advanced Wastewater Disinfection
Before the water is released back into the environment, it needs a final, rigorous polish. We eliminate any surviving pathogens using UV light, ozone, or chemical disinfectants. When chemicals like chlorine or sodium hypochlorite are used, precision is absolutely critical. Integrating highly accurate equipment, such as an AD-Z series mechanical diaphragm metering pump, ensures that the exact required dose is applied. This guarantees the final discharged water is safe, clean, and fully compliant.
Solids Handling and Sludge Management
A comprehensive water treatment process diagram isn\’t just about producing clean water; it must also clearly map out how the facility handles the leftover waste. We are water treatment products supplier and manufacturer, and we know firsthand that efficient solids management is crucial for keeping operational costs down and maintaining an environmentally compliant plant.
Sludge Thickening and Dewatering
When solids are initially separated from the wastewater, they are mostly liquid. We must drastically reduce this water content before further processing.
- Gravity Thickening: Allowing heavy solids to settle at the bottom of a tank while water is skimmed off the top.
- Mechanical Dewatering: Using powerful centrifuges or belt filter presses to physically squeeze the remaining water out of the sludge, transforming it into a thick \”cake.\”
Digester Operations and Stabilization
Once the sludge is dewatered, it is still raw and full of volatile organic material. It moves into digesters to be stabilized, preventing severe odors and eliminating health hazards.
- Anaerobic Digestion: Microorganisms break down the organic matter in a sealed, oxygen-free environment.
- Pathogen Reduction: The sustained heat inside the digesters kills off harmful bacteria and viruses.
- Biogas Production: As a byproduct of digestion, methane gas is produced, which can be captured and burned to generate electricity for the treatment plant.
Safe Disposal of Stabilized Solids
The final step in the water treatment diagram process dictates where these treated solids—now referred to as biosolids—end up. Relying on robust integrated sewage treatment equipment ensures that the sludge is properly separated and stabilized for safe, permanent removal.
- Agricultural Application: High-quality, nutrient-rich biosolids are often spread on farmland as a commercial fertilizer substitute.
- Landfill Disposal: Solids that do not meet agricultural standards are safely transported and buried in permitted landfills.
- Incineration: In areas where land is scarce, the dewatered cake is burned at high temperatures, reducing the final waste footprint to a small amount of ash.
Designing and Drawing Your Own Diagram
We are water treatment products supplier and manufacturer experts, and we know that mapping out your facility is a critical step. A well-designed water treatment process diagram keeps engineers, operators, and contractors on the same page, whether you are upgrading an old system or building a new water plant treatment facility.
Process Flow Diagram Templates
Starting from scratch wastes time. Using standard templates makes outlining the water treatment diagram process fast and accurate.
- Standard Layouts: Pre-made grids help you logically organize the equipment flow from water intake to final discharge.
- Customizable Blocks: Easily drag and drop core components like settling tanks, pumps, and membrane filters to match your exact setup.
- Digital Tools: Specialized software offers built-in libraries perfectly suited for mapping the process of water treatment industrial operations, saving you hours of drafting.
Standard Instrumentation and Piping Symbols
Your diagram is only useful if everyone can read it. Sticking to universal industry symbols ensures clear communication across global teams.
- Valves and Pumps: Always use standardized icons for gate valves, check valves, and dosing pumps to avoid installation errors.
- Piping Lines: Differentiate your main process pipes from chemical feeds and electrical signal wires using solid, dashed, or dotted lines.
- Sensors and Controls: Clearly mark exactly where flow meters, pressure gauges, and pH monitors are placed to streamline both daily operations and future maintenance.